


How do you express your innovation strategy? As a set of action fields? As a horizon split? As a list of strategic search fields, your scouts work against? All three are legitimate. But, what did your innovation portfolio actually fund last quarter? Does it match the priorities of your organization?
Most leaders cannot answer that on the spot. The resources sit in a few hundred individual projects spread across business units, tracked in spreadsheets nobody reconciles against the split agreed in January.
Spreadsheets are where innovation efforts die. Agreeing on a split takes one offsite. Holding the innovation portfolio inside it for four quarters takes an innovation process that most organizations do not have. That is an innovation management problem, not an ideas problem.
This article gives you the three inputs that set your split, the six ways innovation portfolio management leaks after approval, and a 90-day plan to make it enforceable. Success is measured one way: your stated split and your actual innovation portfolio split converge.
Exhibit 1: Strategy development framework
What does an innovation strategy include?
Your mandate is to close the gap between where the core business is heading and where the board says the organization needs to be. To do that, you name the investment areas, you set the resource allocation, and you name what the company will not fund. That is a practical innovation strategy.
An innovation strategy defines how a company closes the gap between today’s performance and future business goals. An innovation strategy outlines the priorities, funding fields, and resource allocation used to close that gap.
A complete innovation strategy has three components.
An ambition with a number and a date. Revenue, margin, or market position by a specific year.
A resource allocation across horizons. How much goes to core, adjacent, and transformational innovation activities?
Decision rights. Who can fund, who can stop, and on what evidence?
The third one is usually missing, and it costs your people the most time. Cordell Hardy of 3M made the point on the ITONICS podcast: an innovator who already knows the company does not manufacture semiconductors will not waste a year championing a semiconductor project. Saying no in public is a gift to the people who work for you.
Most companies have the first two. Almost none write down the third. That omission is the reason your innovation portfolio drifts, and it turns innovation portfolio management into an annual reporting exercise rather than a steering function.
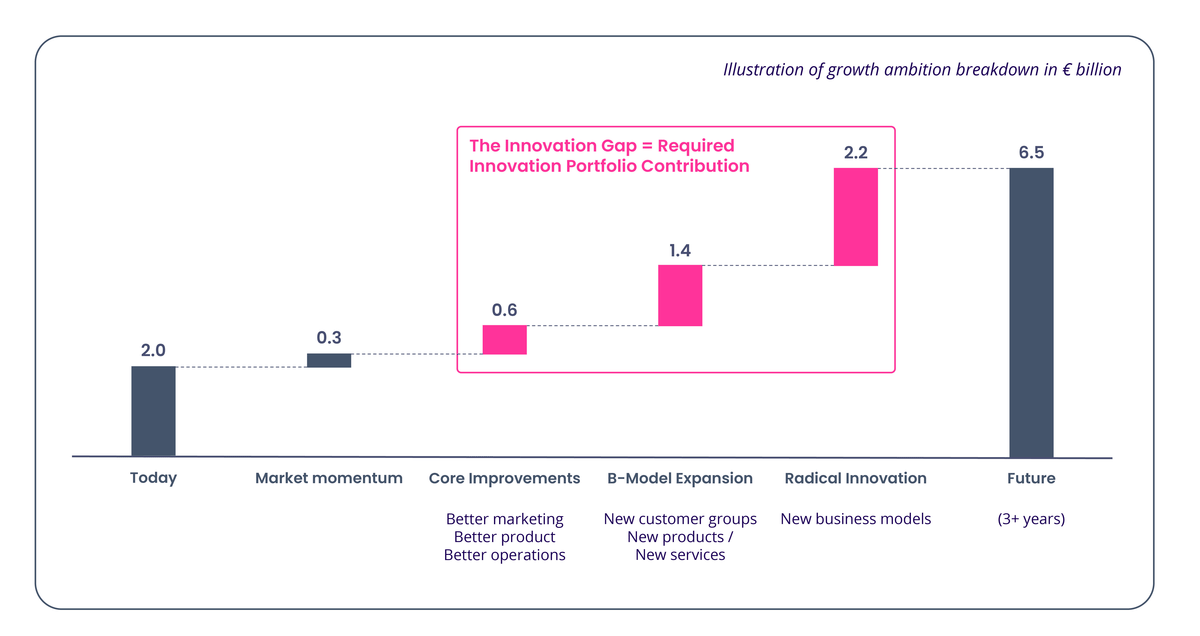
Exhibit 2: Calculating the innovation gap
Is a 70-20-10 innovation portfolio split the optimal choice
Where did your split come from? If the answer is 70-20-10, check what you are actually quoting.
In 2012, Bansi Nagji and Geoff Tuff published “Managing Your Innovation Portfolio” as a Harvard Business Review article. Studying companies in industrial, technology, and consumer goods sectors, their research found that every organization with above-average returns allocated roughly 70% of innovation resources to the core, 20% to adjacent moves, and 10% to transformational bets.
That allocation gets copied everywhere. The second half of the finding gets dropped.
Nagji and Tuff also found that returns run in the inverse. Roughly 70% of long-term value came from the transformational 10%.
Read both halves together, and 70-20-10 stops being a comfortable default. That 10% carries most of your future growth. It is also the line item with the weakest political defense in every budget meeting you sit in.
How to define the optimal innovation portfolio split
Which is why the drift only ever runs one way. Core spending arrives with customers asking for it, a business case behind it, and a P&L owner defending it. This is true at most companies, and it is not irrational. Work on existing products and services, reducing costs, and improving customer experience for current customers is easy to justify. New technologies aimed at a customer base that does not exist yet are not.
So transformational spending gets deferred, re-scoped, or quietly absorbed into a core program. Twelve months later, your portfolio reads 88-10-2. Can you name the meeting where you agreed to that?
Treat 70-20-10 as a benchmark and adjust it. A regulated utility can defend 85-10-5. A software platform whose customers are shifting to new business models may need 50-30-20. One rule holds across all of them. Your innovation strategy is whatever your innovation portfolio shows twelve months later.
Industries
Horizon 1
Horizon 2
Horizon 3
Consumer Goods & Retail
60-70%
20-30%
5-10%
Finance & Banking
70-80%
30-40%
5-10%
ICT
50-60%
20-30%
10-20%
Manufacturing
60-70%
10-20%
5-10%
Construction
70-80%
15-20%
5-10%
Automotive
60-70%
20-30%
5-10%
Energy
70-80%
15-20%
5-10%
Defense & Aerospace
50-60%
20-30%
10-20%
Pharma
50-60%
20-30%
10-20%
Exhibit 3: Typical innovation portfolio splits across industries
Which three inputs set your optimal innovation portfolio split?
The Three Horizons model entered the business world in 1999, published by Baghai, Coley, and White in McKinsey’s The Alchemy of Growth. It gives you the buckets. It does not tell you how to fill them. Three company-specific inputs do that, in sum, help you to craft your innovation operating model.
How your company’s biography influences your innovation process
Your capabilities, resources, and culture were set by decisions made long before you took the role. A company that made a bold bet and won will let you make another one. An organization sitting on a graveyard of failed ventures will underfund Horizon 3 regardless of what the strategy says. Culture is a hard constraint on the split you can defend.
Look at your record with new products and new business models. Companies that shipped one clear success outside the core in the last decade have a culture that tolerates risk. Organizations with a decade of near misses do not, and no amount of process changes can occur within one planning cycle.
Run one diagnostic before you write any number down. Pull every innovation project killed in the last five years and check why each one died.
Were any stopped at a gate for lack of evidence? Or were they all stopped by budget cuts?
If it is the second, your governance is financial rather than strategic. That tells you what allocation this organization will actually tolerate, which is more useful than what it will nod along to in the offsite.
Past earnings also set your ceiling. Available cash defines the size of the budget you are arguing about in the first place.
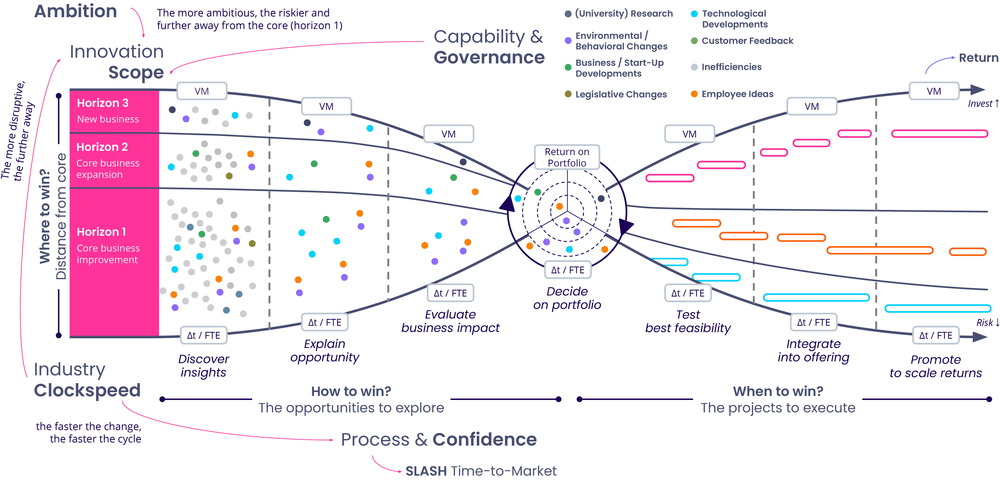
Exhibit 4: Innovation operating model framework
How an industry’s clock speed influences innovation decisions
Industry clock speed is the rate of change in your market. It sets how fast you have to move from exploration to launch, and how much you have to fund beyond the core to remain competitive.
Your radar tells you which technologies and trends are moving. It does not tell you how fast you have to move, and a technology roadmap is not a substitute for that number.
Measure it instead of asserting it. Take the time between a competitor shipping new products and your organization shipping a credible response. Compare that to how often the dominant design in your industry resets. That comparison, not a slide about trends, is what gives you a deep understanding of the window you are working inside.
In a highly competitive market, the gap closes fast. If your development cycle runs 24 months and the industry resets every 36, you have almost no slack. That argues for more Horizon 2 and 3 funding and for shorter gates. It does not argue for executing harder on the core.
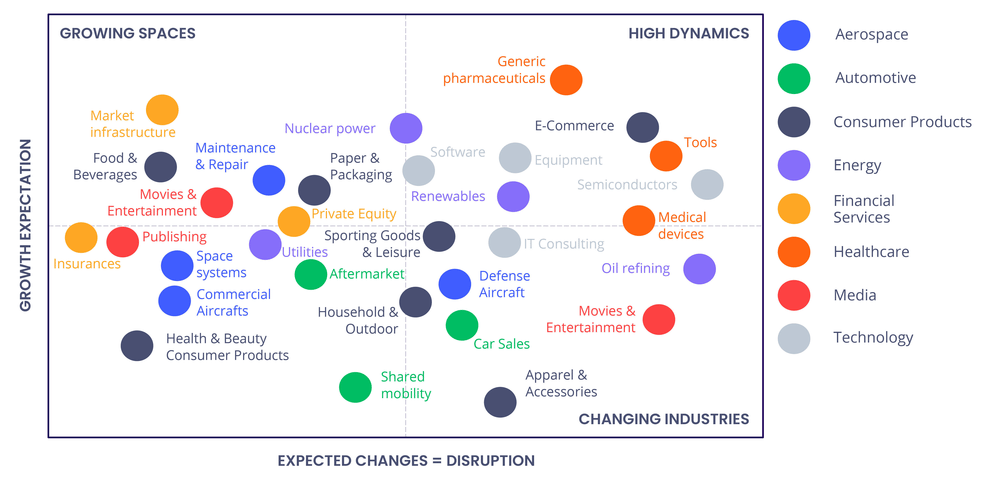
Exhibit 5: Clock speed of different industries
How to turn an ambition into an innovation strategy
Ambition is only useful once it carries a number and a deadline. The innovation gap is a revenue figure. Ideas are cheap, and your pipeline is full of them. Good ideas are not the constraint. Funding them past the first gate is. The gap tells you how much future growth those ideas have to produce, and by when.
Take a company at €2 billion in revenue today, aiming for €6.5 billion in three years. That is a €4.5 billion gap and a 48% compound annual growth rate.
No mature industrial business closes a 48% CAGR from core investment. Core investment in a saturated market buys diminishing returns. Each additional euro spent on existing products yields less than the previous one. You still spend heavily there, because withdrawing that spend loses customers.
So either the ambition is unrealistic, or the split has to move toward adjacent and transformational work. Say which, in writing, before anyone in the room argues about percentages.
Four steps turn an ambition into an allocation someone can be held to.
State the ambition. One revenue number, one date. Take it from the board deck, not from your own team’s planning.
Project the trajectory. What does the core business deliver by that date at current growth rates, with maintenance investment only?
Subtract. The difference is your innovation gap. This revenue has to come from somewhere new.
Assign the gap. Decide what share of it each horizon must produce, and name the team that owns each number.
Most organizations finish step one and stop there. Step four is what makes an innovation strategy enforceable, because it converts a percentage into an owner and a target. Creating that link between ambition and execution takes an afternoon. Skipping it costs you the year.
Each horizon then needs resources of its own and the authority to stop projects. Without that, the organization defaults to whoever shouts the loudest. Sponsorship models guarantee core creep.
If a new idea has to find a sponsor inside a business line to get funded, it only gets funded when it helps that business line’s P&L this year. That filter kills Horizon 3 by design, and nobody in the organization has to decide to do it. The risk never gets debated. It gets budgeted away.
How do you connect your innovation strategy and innovation portfolio management?
The enforcement layer has four parts. Build all four, or the split drifts again inside two quarters.
1. One portfolio of record. Every initiative in one system, with horizon tag, budget, owner, stage, and status. Spreadsheets held per business unit make actual resource allocation unknowable, and an innovation portfolio you cannot see is an innovation portfolio you cannot steer.
2. Metered funding with written kill criteria. Fund one stage at a time. Before each tranche, define what evidence the next gate requires. If the evidence does not arrive, stop the project. This is the single change that converts risk from something you report into something you act on.
3. A standing forum on a 90-day cadence. One committee sees every horizon and every unit and makes exactly three decisions per initiative: fund, stop, or scale. This is the key governance body, and it owns execution risk across the whole portfolio.
4. One number per quarter. Actual allocation by horizon against the split your innovation strategy commits to. If those diverge by more than five points, move the resources or change the plan. Both are legitimate. Ignoring the divergence is what turns innovation strategy back into a slide.
/Still%20images/Kanban%20Board%20Mockups%202025/capabilities-views-kpi-aggregation.webp?width=1440&height=900&name=capabilities-views-kpi-aggregation.webp)
Exhibit 6: An innovation portfolio board inside ITONICS
Rules for formulating your innovation strategy
Organizations that want to formulate the optimal strategy should be clear on their biography (the assets they own), their ambition (the growth they aim for), and industry clock speed (the change expected). A clear picture of these factors will result in the ability to create the right commitment.
Key rules of thumb are:
The more ambitious an organization is, the more it needs to move funding from Horizon 1 to Horizons 2 and 3
The more disruption is expected, the more it must move funding from Horizon 1 to the other Horizons
The faster the change, the faster the company needs to move from opportunity exploration to go-to-market
Each team needs to own opportunity exploration and execution, thus requiring their own resources to explore and test
The more mature (and saturated) an industry is, the less growth can be expected from only investing in the core
Every industry has a lifecycle and will reach saturation. At some point, it will, therefore, be important for any company to move beyond its core business.
To explore new opportunities (in Horizon 3), collaborating with start-ups and universities is a less costly alternative to the company’s own research and development.
Every innovation engine you employ needs to have a direct connection and positive contribution to your corporate ambition.
To pursue a moderate ambition, a 70-20-10 split is seen as the best funding split across different contexts.
Where does innovation portfolio management leak after approval?
Six essential mechanisms erodes every innovation strategy, and every one of them is a failure of innovation management rather than a shortage of ideas.
Core creep. Every individual reallocation toward the core is defensible. The aggregate never gets reviewed. Report actual spend by horizon quarterly, not annually.
Unowned horizons. Nobody is the leader for the transformational number, so nobody defends it. Assign a named owner per horizon with a revenue target attached. Unowned horizons collect new ideas and innovate in none of them.
Sponsorship instead of budget. Ring-fence the resources. New ideas that have to beg operating units for funding never leave the core and drive true innovation.
Full funding at kick-off. Approving the whole project budget on day one removes the moment when stopping is possible. The innovation process exists to build evidence in stages. If a stage produces no new confidence, end the project there.
No single innovation portfolio view. Leadership sees the initiatives it is shown. Duplicate innovation projects in two business units go unnoticed for years, and you are the one who looks careless when they surface.
No standing decision forum. Without a growth board or an equivalent committee with a view across every horizon and every unit, fund and stop calls get made unit by unit. That reproduces the silos the project was supposed to break.
The pattern behind all six is the same. You have the strategy. But, you have nothing to enforce it. In every one of these examples, the strategy survives on paper while the value quietly moves back to the core.
Many organizations sit exactly here. In an ITONICS analysis of 2,310 recorded sales conversations, portfolio and prioritization came up in 68% of the 2,193 calls with enough customer talk to analyze. The alternative most often named was Excel, in 20% of calls. A spreadsheet is a powerful tool for a single group and a liability for a portfolio of 400 innovation activities.
What does a working innovation process look like at Toyota and GOLDBECK?
The best examples share one trait. The examples below made the whole portfolio visible in one place, then made someone accountable for each part of it. Success followed the visibility, not the framework.
Toyota Motor Europe: 200 innovation projects in one place
Toyota Motor Europe’s production engineering was asked to streamline discovery and innovation activities across every manufacturing center the organization runs in Europe. They evaluated 40 innovation software systems before selecting the ITONICS Innovation OS.
More than 500 Toyota members now work in one system. Around 200 projects of varying size, worth more than €20 million, sit in a single pipeline alongside a visible queue of new proposals. The platform also carried 58 external events, letting hundreds of contributors evaluate new project proposals.
The number to steal is 200 in one place. Portfolio efficiency starts with a count you trust. Before that, project information was scattered across sites, departments, and employment types. Nobody could see the whole innovation portfolio, so nobody could check resource allocation against the business goals. Efficiency was the stated goal. Visibility was the mechanism that delivered it, and the process now runs on one system rather than four.
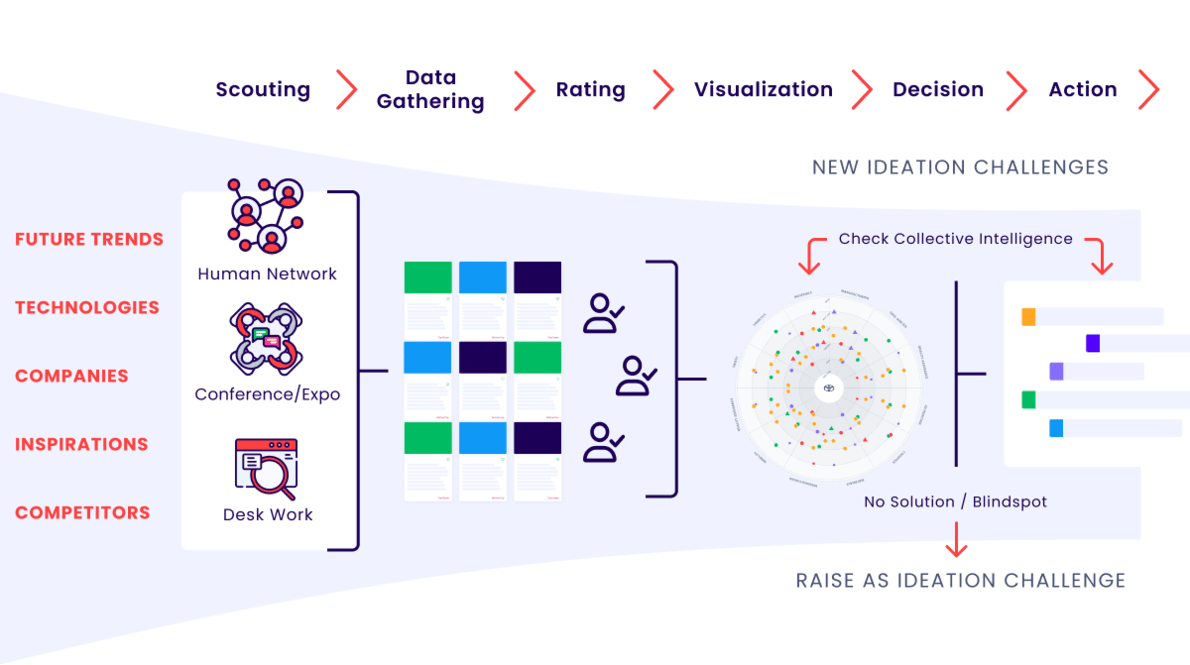
Exhibit 7: Toyota Motor Europe’s innovation process
GOLDBECK: 1,600 startups and named ownership
GOLDBECK solved the ownership half. The construction group runs around 500 projects a year on standardized components, so a single technology change scales across the whole portfolio immediately.
Group Innovation screened over 1,600 startups and tracked 280 use cases across 32 search fields. Ownership is explicit: 18 Innovation Ambassadors covering 6 departments across 11 teams, each with a quarterly one-on-one with the Group Innovation team.
Maximiliane Straub, who leads Group Innovation there, says they would never have known the scale of their own startup activity otherwise.
How does ITONICS turn an innovation strategy into portfolio decisions?
ITONICS is strategic portfolio intelligence for enterprise R&D and innovation. It gives the enforcement layer somewhere to live, so innovation portfolio management stops depending on whoever remembers to reconcile the spreadsheet.

Exhibit 8: ITONICS Prism creates a trend radar
One portfolio of record. Every initiative sits as a content element in a shared workspace, with configurable element types, ratings, and properties. Grid and Table views show every element with the columns you choose. Creating a view for products, services, or a single business unit takes minutes and no code.
Horizon and distance scoring. Rating criteria attach to each element. The Matrix maps every initiative on two configurable axes, so offering distance and market distance become a picture instead of a spreadsheet column.
Actual against target allocation. Creating the board view is a filter, not a project. Dashboards aggregate budget and status by horizon. PPT and PDF export with configurable templates covers the steering committee, because board reporting still happens in slides.
Metered funding and kill decisions. Creating a gated workflow takes no code. Configurable processes with phases and gates hold the governance across the innovation lifecycle. Each gate defines what evidence the next tranche requires.
Radar and Prism. The Radar tracks trends, new technologies, and startups against your search fields, so scouts can explore emerging technology and new services without leaving the system the portfolio lives in. Prism, the platform’s context-aware AI, checks initiatives against strategy, surfaces misalignment, and recommends fix, re-scope, or stop. It flags budget, staffing, and schedule risk early, so the stop decision arrives before the sunk costs do. That is how you focus scarce resources on the initiatives with a future.
More than 200 companies run their innovation portfolios on ITONICS, among them Toyota, DB Schenker, Cisco, Siemens Energy, and GOLDBECK. Explore what fund, stop, and scale decisions look like on live portfolio data.


