


by Braden Kelley
Your dashboard says customers are satisfied. CSAT is green. The quarterly deck gets a polite nod. Meanwhile, expansion stalls, renewals quietly soften, and support costs creep up — and nobody can point to a single “bad” survey score that explains it.
That isn’t a mystery. It’s a metric paradox: CSAT can look fine while revenue leaks, because satisfaction surveys and financial outcomes measure different things on different clocks.
If you lead CX, product, support, or a P&L, this gap is where budget conversations die. Leaders feel the leak. The score refuses to confess. So the investment stalls.
What CSAT Actually Measures (and What It Doesn’t)
CSAT usually answers a narrow question: how satisfied was someone with a specific interaction or recent experience? That’s useful. It is also incomplete.
CSAT tends to miss:
Silent churn — customers who never complain, then don’t renew, don’t expand, or quietly reduce usage
Effort and friction — people who “succeed” after three workarounds and still tick Satisfied because the alternative was worse
Non-respondents — the angry and the indifferent often skip the survey; the polite remain
Journey seams — handoffs between marketing, sales, onboarding, billing, and support where trust dies between touchpoints
Lag — revenue damage compounds for months before it shows up as a churn spike leadership will fund
So the score can stay “fine” while the experience failures draining your P&L keep working.
The Metric Paradox in Plain Language
Here’s the pattern I see in Customer Experience Audits:
A customer hits friction (confusing onboarding, surprise fees, repeated authentication, a broken promise after purchase).
They still complete the task — eventually — so the transactional CSAT looks acceptable.
They tell fewer colleagues. They stop exploring add-ons. They price-shop next renewal. They open more tickets.
Finance sees softer expansion and higher cost-to-serve. CX sees a green dashboard.
Both sides are “right” inside their metrics — and wrong about the business.
CSAT is not lying. It’s answering a different question than the one the CFO is asking.
Why Leaders Trust the Wrong Green Light
Organizations over-index on CSAT (and sometimes NPS) because the number is:
Familiar in the board pack
Easy to benchmark
Simple to own in a slide
What’s missing is the chain from experience → behavior → dollars. Without that chain, “improve CX” sounds like a vibe. With it, friction becomes a funding conversation.
I’ve written separately about how to calculate customer experience ROI using that chain. This piece is about why you need it even when — especially when — CSAT looks fine.
Five Signs CSAT Is Masking Revenue Leakage
High CSAT, flat or falling expansion — satisfied enough to stay, not inspired to buy more.
High CSAT, rising contact rate — people are “satisfied” with heroic recoveries you shouldn’t need.
High CSAT in support, weak onboarding completion — you’re measuring the rescue, not the journey.
Promoters who still churn on price — affection without switching costs or realized value.
Teams arguing about the score instead of walking the journey — the map has replaced the territory.
If two or more of these feel familiar, your dashboard is under-reporting risk.
What to Measure Alongside CSAT
Keep CSAT. Add instruments that speak to money and effort:
Leading behaviors: activation, time-to-value, repeat purchase, expansion, referral attempts
Effort: CES or task completion without assistance
Cost-to-serve: contacts per customer, repeat contacts, escalation rate
Experience Level Measures (XLMs): human-success metrics tied to specific “ugh” moments — not just uptime SLAs (more on XLMs here)
Journey evidence: what an outside-in audit finds when someone actually walks the experience
Scores without journeys produce false calm. Journeys without dollars produce false urgency. You need both.
Put a Number on the Leak (Even a Conservative One)
You don’t need false precision. You need a credible range that makes the paradox discussable in a budget meeting.
Start with what you already know — customers, revenue per customer, churn, service cost — and estimate what a realistic improvement in retention or cost-to-serve is worth annually.
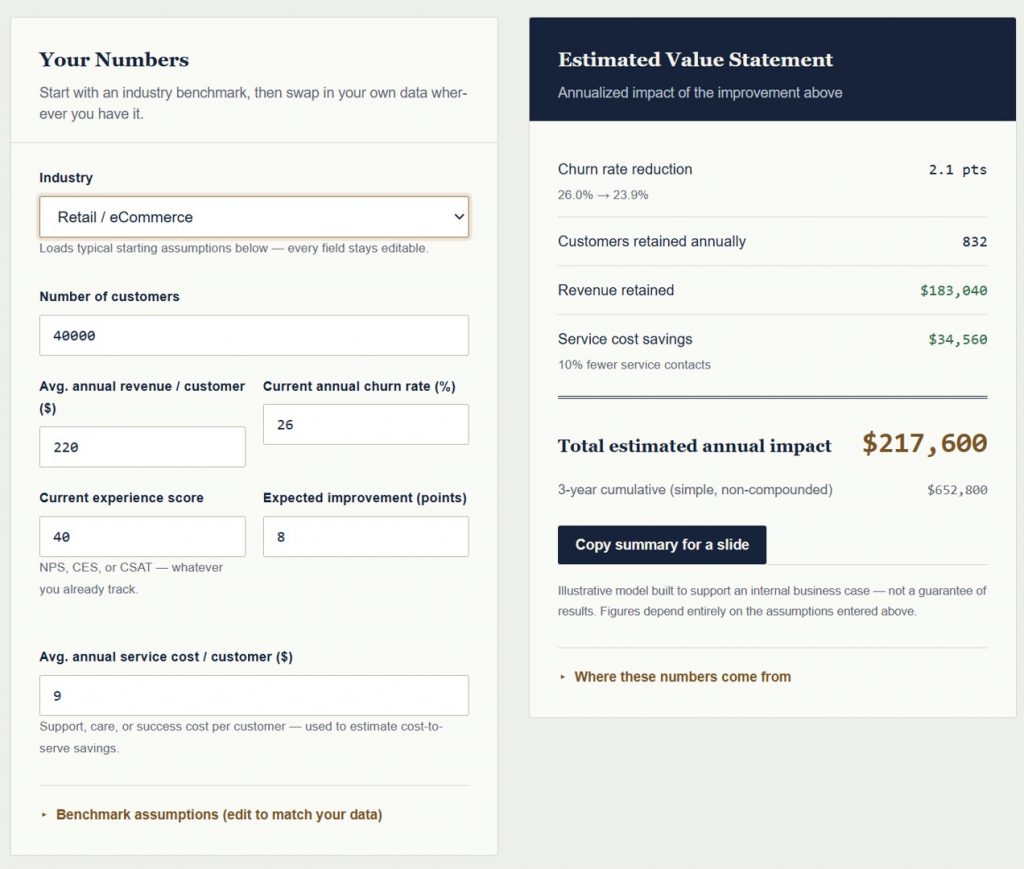
Use the free Customer Experience ROI Calculator →
It runs that estimate with your numbers (or industry starting points), and you can copy a summary for a slide. The point isn’t to worship the model. The point is to stop pretending a green CSAT tile equals a healthy P&L.
From Estimate to Action
Once you have a number, the next question is where the leak lives. That’s what a human-centered Customer Experience Audit is for: walk the real journey, find the friction inventory, and prioritize fixes by revenue impact — not by whoever shouted loudest in the last QBR.
CSAT can look fine while revenue leaks. The organizations that pull ahead are the ones willing to measure the leak — then fix the experience that caused it.
Next step: Run the CX ROI Calculator (about two minutes). If the estimate bothers you, that’s useful information — and a good reason to talk about an audit.
The fastest way to see this framework in action is to run it against your own business — enter your customer count, revenue per customer, and current churn rate (or start from an industry benchmark), and it estimates the annual revenue and cost-to-serve impact of a defined experience improvement, along with a summary you can paste straight into a slide.
Get the CX ROI Benchmark Report — the full industry benchmark table with sources, the CX Value Chain framework, and answers to the five objections a CFO is most likely to raise. Enter your email and we’ll send it straight to your inbox.
If after exploring the ROI calculator you would like to explore unlocking revenue opportunities for your business with a Customer Experience Audit, contact me directly. I’m happy to have a no-obligation conversation about whether an audit makes sense for your current situation.
Image Credit: Cursor
Content Authenticity Statement: The topic area, key elements to focus on, etc. were decisions made by Braden Kelley, with a little help from Cursor to clean up the article and add images.
 Sign up here to get Human-Centered Change & Innovation Weekly delivered to your inbox every week.


