


Industrial companies track 200+ technologies per quarter on average. They publish dashboards. They run quarterly reviews. Then most of them ship the same products with the same processes they had without a technology intelligence function. The problem is the gap between technology assessment and action.
Most technology capability analysis programs produce slides instead of decisions. Decision makers see signals from every direction. They lack the rules that convert signals into specific moves on specific timelines. The pain points are the same across most industrial firms: too much technology assessment, too little operational efficiency.
This article gives you a 7-rule framework to fix that (Exhibit 1). The framework forces a decision on every monitored technology. It links each one to a business goal, an owner, and a 90-day cadence.
Exhibit 1: The 7-rule framework for technology capability analysis
If you are responsible for technology investments at an industrial company, the next few minutes will reshape how your team operates. You will stop monitoring everything and start acting on what matters.
Why most technology capability analysis programs miss the point
Most industrial companies build their technology assessment around input volume: More sources, more signals, and more reports. This volume-driven technology assessment crowds out strategic planning and erodes competitive advantage.
The result is a comprehensive set of data and zero conviction. Decision makers drown in monitoring. They cannot tell which signals demand action this quarter and which can wait two years.
The deeper problem sits inside the workflow. Technology capability analysis is treated as a reporting function, not a decision-making process: The team monitors, leadership reviews, and nothing changes. Technology assessment loops repeat, and strategic planning stalls.
A useful technology capability analysis answers three questions in writing:
Which existing technologies should we stop using?
Which emerging technologies should we pilot in the next 90 days?
Which new technologies should we ignore for now?
Industrial companies that get this right cut their technology stack by 18% to 25% within 12 months. They redirect that budget into 3 to 5 high-conviction bets per year.
What technology capability analysis means for industrial operations
Technology capability analysis is the structured approach to mapping your existing technology environment against business strategy, identifying gaps, and deciding where to invest.
It is not technology scouting. Scouting finds emerging technologies. Capability analysis decides what to do with them.
It is not a technology assessment report. Reports describe the current state. Capability analysis prescribes the next move.
A working technology capability analysis covers five elements (Exhibit 2):
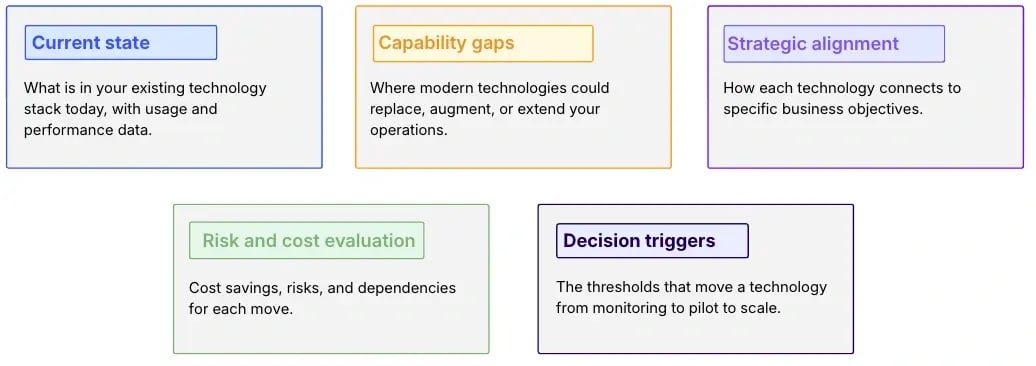
Exhibit 2: The five elements covered by a technology capability analysis
The output is a short list of decisions with owners and timelines.
Industrial companies that treat technology capability analysis as a decision-making process see two outcomes within 18 months. They reduce shadow IT and duplicated platforms by 30% or more. They also accelerate the adoption of high-impact technologies like machine learning and cloud computing by 6 to 9 months.
Three failure patterns in technology assessment
Most technology assessment efforts fail in predictable ways. The three patterns below explain 80% of cases where a thorough evaluation produces no action. Each pattern is a specific technology assessment anti-pattern observed across industrial firms.
Pattern 1: Monitoring without filters
Teams track 150 to 400 emerging technologies. They cannot remember why most of them were added, and these monitoring lists create information overload that makes useful insights harder to extract. There is no threshold for removal, so the list grows every quarter.
Pattern 2: Assessment without decision rights
The organization’s technology team scores capabilities, and leadership reviews the scores through the defined approval structure. Nobody can approve a pilot without a steering committee that meets quarterly.
Pattern 3: Roadmap without triggers
The technology roadmap shows quarterly milestones. Nobody knows what would cause a milestone to advance, slip, or get cancelled, and unclear triggers make it harder to measure success and respond to implementation challenges.
These three patterns share a root cause. Technology assessment is treated as analysis when it should be the input layer to a decision-making process. Without that shift, every technology assessment cycle produces inventory instead of informed decision-making. The structured approach below fixes this.
Each pattern has a measurable signal:
If your team has more than 40 monitored technologies, you have Pattern 1.
If pilot approvals take more than 8 weeks, you have Pattern 2.
If your roadmap has not changed in two quarterly reviews, you have Pattern 3.
Thus, diagnose first and then apply the framework.
The 7-rule framework for informed decision-making
Use these seven rules to convert technology capability analysis from a reporting exercise into a decision-making engine. The framework turns raw technology assessment into informed decision-making in 6 weeks. Each rule is binary. You either follow it or you do not.
How to apply the framework in 6 weeks
Most industrial teams cut their watchlist by 40% to 60% in the first cycle. The remaining items have owners, business goals, and clear triggers. That is a working foundation for strategic management.
Week 1: Run rules 1 and 2 across your current watchlist. Anything without a business goal gets cut.
Week 2 to 3: Run rule 3. Assign owners. Empty owners or shared owners get cut.
Week 4: Apply rules 4 through 7. Set the cadence, cap the list, write the triggers.
Weeks 5 to 6: Run your first review under the new rules. Make stop, pilot, or scale decisions on every technology that remains.
How to identify areas where new technologies match business goals
Identifying areas where new technologies create value requires a thorough evaluation against actual business goals, not generic capability lists. Without this discipline, technology assessment drifts away from operational efficiency and strategic planning.
Start with the five most expensive problems in your operations. For most industrial companies, these include unplanned downtime, energy consumption, quality defects, supply chain delays, and labor shortages in specialized roles. Quantify each one in dollars.
Then map your current systems and information technology capabilities against each problem, not just your existing technologies. Mark the gaps. The gaps are where new technologies earn the right to be evaluated, including solutions that can support future growth or new offerings.
This narrows your evaluation from “what technology is interesting” to “what technology closes our top five gaps.” Industrial firms applying this filter cut their watchlist from 150 to 180 technologies down to 25 to 35 within one cycle.
For each gap, ask three questions:
What is the dollar value of closing this gap?
Which modern technologies have proven results in similar contexts?
What is the cost-effective path to a 90-day pilot?
This identifies areas where capability gaps and emerging technologies overlap. Anything outside that overlap is noise.
Risk management with machine learning in capability analysis
Risk management in technology capability analysis is where industrial companies lose the most money. Not from bad bets, but from slow decisions on bets that should have been killed earlier.
Machine learning helps in three specific ways (Exhibit 4). Each requires real implementation, not vendor demos.
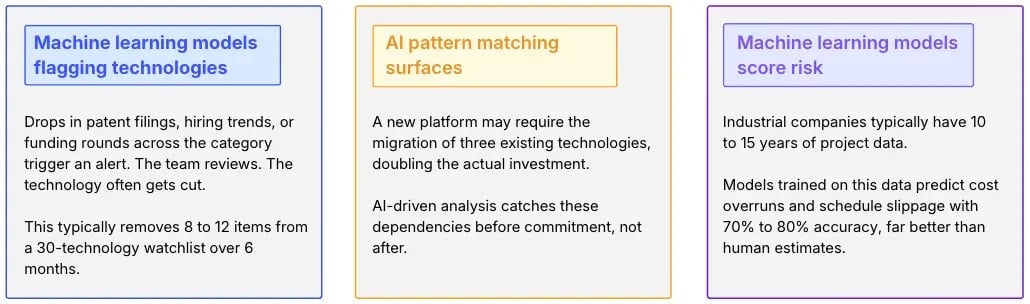
Exhibit 4: Three ways of machine learning helping in risk management
To mitigate risks effectively, run machine learning analysis at every 90-day review. The output should highlight 2 to 4 technologies where the risk profile has shifted enough to demand a stop, pilot, or scale decision.
Building a clear roadmap to your strategic goals
A clear roadmap converts your technology capability analysis into time-bound commitments. It connects each technology investment to one or more strategic goals, with owners, milestones, and decision triggers, creating an effective foundation for clearer prioritization.
The roadmap follows a three-horizon structure:
Total roadmap items: 25 to 40. Anything beyond that is a sign your analysis is producing inventory, not decisions.
Review the roadmap every 90 days against changing market conditions. Move items between horizons. Cut what no longer fits. Add what now does.
Industrial companies that maintain this discipline achieve two outcomes. They reach scale on high-impact technologies 6 to 9 months faster than peers. They also reduce wasted investment in deprioritized technologies by 30% to 40% per year.
How ITONICS supports technology capability analysis and decision-making
ITONICS provides the structured approach industrial teams need to run technology capability analysis as a decision-making process, not a reporting exercise.
Three capabilities matter most for technology investments at industrial firms:
#1: Technology radar with scoring. Map up to 30 technologies on a configurable radar (Exhibit 5). Score each one across six dimensions with weighted criteria. Filter by business goal, owner, or horizon. Decision makers see capability, risk, and timing in a single view. The radar is embedded on any internal page for key stakeholders without a platform login.
/Still%20images/Radar%20Mockups%202025/capabilities-collaboration-clustering-evaluating-viewing.webp?width=966&height=604&name=capabilities-collaboration-clustering-evaluating-viewing.webp)
Exhibit 5: Map your landscape in one interactive view with technology radars
#2: Decision triggers and 90-day cadences. Configure triggers per technology. The platform alerts owners when a trigger fires, whether that is a patent filing surge, a competitor move, or a missed milestone. Watch alerts replace status meetings.
#3: Prism AI for capability analysis. Prism, the platform’s AI layer, runs pattern analysis across your existing technologies and emerging signals (Exhibit 6). It flags dependencies, suggests owners based on past performance, and highlights technologies where the risk profile shifted in the last 90 days.
/Still%20images/AI%20Mockups%202025/foresight-discover-new-insights-2025.webp?width=966&height=604&name=foresight-discover-new-insights-2025.webp)
Exhibit 6: Let Prism read the heat and recommend projects before others even react
The platform supports the full process: watchlist management, scoring, 90-day reviews, triggered decisions, and roadmap visualization across horizons. Industrial teams using ITONICS for technology capability analysis report 40% to 60% faster decision cycles and 25% reduction in unused platform investments within 12 months. That is a measurable competitive advantage.
The goal is straightforward. Convert monitoring into informed decision-making, every quarter, against your strategic goals.


