

NASA spent around 23 billion dollars developing the Space Launch System over 13 years. SpaceX built Starship in five, on a roughly one-third-of-a-billion-dollar budget. NASA outspent SpaceX by about 7x and still shipped 3x as slowly.
More money bought less speed. That comparison breaks the most common assumption in industrial companies: that a long time to market is a budget problem, solved with bigger budgets, more program managers, or another oversight layer.
McKinsey puts the cost of the alternative in plain numbers. Inefficient decision-making burns roughly 530,000 days of manager time a year at a large company. That is close to 250 million dollars in wasted wages, per company, per year.
So the question is not how to spend more. It is what friction you have naturalised that you should be removing. This article makes the case that slow product development in industrial goods is a governance problem, then gives the four moves the fastest hardware builders use to cut time to market, and where to start.
Structural failure
What it looks like
What it costs
Fragmented portfolio data
Programme status lives across ERP systems, spreadsheets, and last Thursday’s slide deck. No single person holds a complete view.
Portfolio decisions become archaeology. Half the review goes to reconstructing reality before anyone can decide.
Approval cycles built for annual governance
Phase-gates and budget reviews run on quarterly or annual cadences. By the time an approval clears, the market has moved.
45% of new product launches slip by at least a month. 90% of delays trace to late-stage design changes that were visible earlier.
No unified view of tradeoffs
Resource allocation is political, not analytical. The loudest voice gets the engineers. Teams optimise locally because no one sees globally.
Strategic drift stays invisible until the annual review, usually too late to fix without rework. A 12-month delay can cost an OEM up to $200M in lost profit.
Scale mistaken for innovation capability
Conglomerates, corporate labs, and internal capability programmes assumed size and investment would compound into innovation returns.
GE, Honeywell, and 3M broke themselves up. Ford closed its Silicon Valley lab. VW tied a 35,000-job restructuring to decades of structural problems.
Transformation programmes as the fix
The dominant advice from 2015 to 2022 was to set up the lab, fund the accelerator, and launch the transformation programme.
Corporate transformation efforts have failed at 70% to 88% for a decade, stable across hundreds of billions spent.
Record R&D spending without productivity gains
The standard response to slow development is more resources: more programme managers, bigger budgets, new oversight functions.
NASA outspent SpaceX by 7x and finished years behind. More oversight did not buy more speed.
Exhibit 1: The structural failures, what they look like, and what they cost
Why a bigger budget and development team do not reduce time to market
Time to market is the interval from product concept to first customer shipment. It runs from the initial release of a product idea to a successful product launch. Time to market shows considerable variation across different industries, but the lever that moves it is the same everywhere.
Cut the time to market, and you reach the market faster than competitors who treat speed as something to purchase.
The standard response to a slow product development process is to add resources:
More program managers.
A bigger innovation budget.
More project management software.
The evidence does not support the reflex. Record R&D spending across large industrial companies has not produced matching gains in development process throughput, and rarely shortens time to market.
Despite talent, capital, and engineering depth, NASA finished years behind a competitor it outspent seven to one. The binding constraint was instead how many people had to agree before anyone was allowed to build.
That is the pattern across the many product development cycles. Two companies with an equivalent product development process and equal technical complexity can run decision cycles that differ by a factor of ten.
The difference lies in R&D governance. Complexity and frequent iterations are a given in industrial goods. Coordination overhead is a choice, and it sets the time to market more than budget does.
Budget treats time to market as something you buy. The faster builders treat it as what is left once the drag is gone.
Exhibit 2: R&D governance structure
Why the old product development process is being dismantled
The three structural failures behind slow product development are not new. What is new is that incumbents have stopped patching them from inside the old playbook and started dismantling the playbook itself.
GE dissolved a 131-year-old company into three focused entities in April 2024.
Honeywell announced a three-way split in February 2025.
3M spun off its healthcare division.
Ford closed its Silicon Valley innovation lab.
Volkswagen cut 35,000 jobs, with its CEO attributing the crisis to decades of structural problems.
These moves reject the dominant advice of the prior decade.
From 2015 to 2022, the playbook was to set up the lab, fund the accelerator, and launch the transformation programme.
Teams tried implementing agile methodologies, ran minimum viable product pilots, and bought more project management software, expecting a shorter time to market. Agile methodologies borrowed from software promised speed on their own. The failure rate of those transformation efforts held between 70 and 88 percent, stable for a decade across hundreds of billions spent.
Layering agile methodologies and agile practices on top of an annual governance model does not change the governance model. The drag stays, and the time to market with it. The structural fix is to remove the coordination overhead, not to install another process around it.
Three structural failures that slow product development in industrial goods manufacturing
Slow development and declining R&D productivity share three properties. They appear together because each one reinforces the others. None is a technology problem. Each is a governance choice that has become invisible through repetition.
Fragmented data across project management tools
Critical programme information lives across project management software, ERP systems, spreadsheets, email chains, and whichever presentation the programme manager updated last.
Most teams add another piece of project management software rather than connecting the ones they already run. No single person holds a complete view of the product development process.
Portfolio decisions become acts of archaeology. Half the review is spent reconstructing reality before anyone can decide anything. When data is scattered across forty tools, the synthesis work itself becomes the bottleneck.
Approval cycles built for annual governance, not weekly product releases
Phase gates and budget reviews still run on quarterly or annual cadences at most large industrial companies.
That was rational when an automotive platform lasted eight to ten years. Those platforms now refresh every three to five years, and software updates ship to existing products in months.
The approval process has not kept pace with the product.
By the time a gate clears, the market conditions that triggered the decision have moved.
A project management cadence set once a year cannot steer a product that changes every quarter.
Slow governance compounds. The longer your approval cycles run, the less time you have between them, and the further behind you fall with each turn.
No unified view of tradeoffs before a product launch
Without portfolio visibility, resource allocation turns political rather than analytical. The loudest voice, or the programme closest to senior leadership, gets the engineers. Teams optimise locally because no one can see globally.
Strategic drift stays invisible until the annual review, which is usually too late to fix without rework. The cost is not abstract. A twelve-month launch delay on a major programme can cost an OEM up to 200 million dollars in lost profit. Each day of delay on a new vehicle model costs roughly a million dollars in forgone earnings.
/Still%20images/Reports%20Mockups%202025/portfolio-optimize-portfolio-returns-2025.webp?width=2160&height=1350&name=portfolio-optimize-portfolio-returns-2025.webp)
Exhibit 3: Innovation dashboard showing relevant KPIs inside ITONICS
The delay tax is widespread. Gartner finds that 45 percent of every new product launch slips by at least a month. Around 90 percent of engineering leaders admit to delaying a market launch because of late-stage design changes, most of which were visible earlier in the programme.
A late product launch surrenders first-mover advantage. It cedes market share, weakens revenue growth and sales growth, and erodes brand reputation while a competitor reaches the market quickly. A slow time to market is a direct hit to market share, not a scheduling footnote.
Four moves that speed up the product development process
The fastest hardware builders are not working harder. They have removed enough drag that the same work produces faster results. Analysis of their governance and product development process points to four moves: simulate, acquire, co-locate, ship.
Each removes one naturalised friction, and each shortens the time to market on its own.
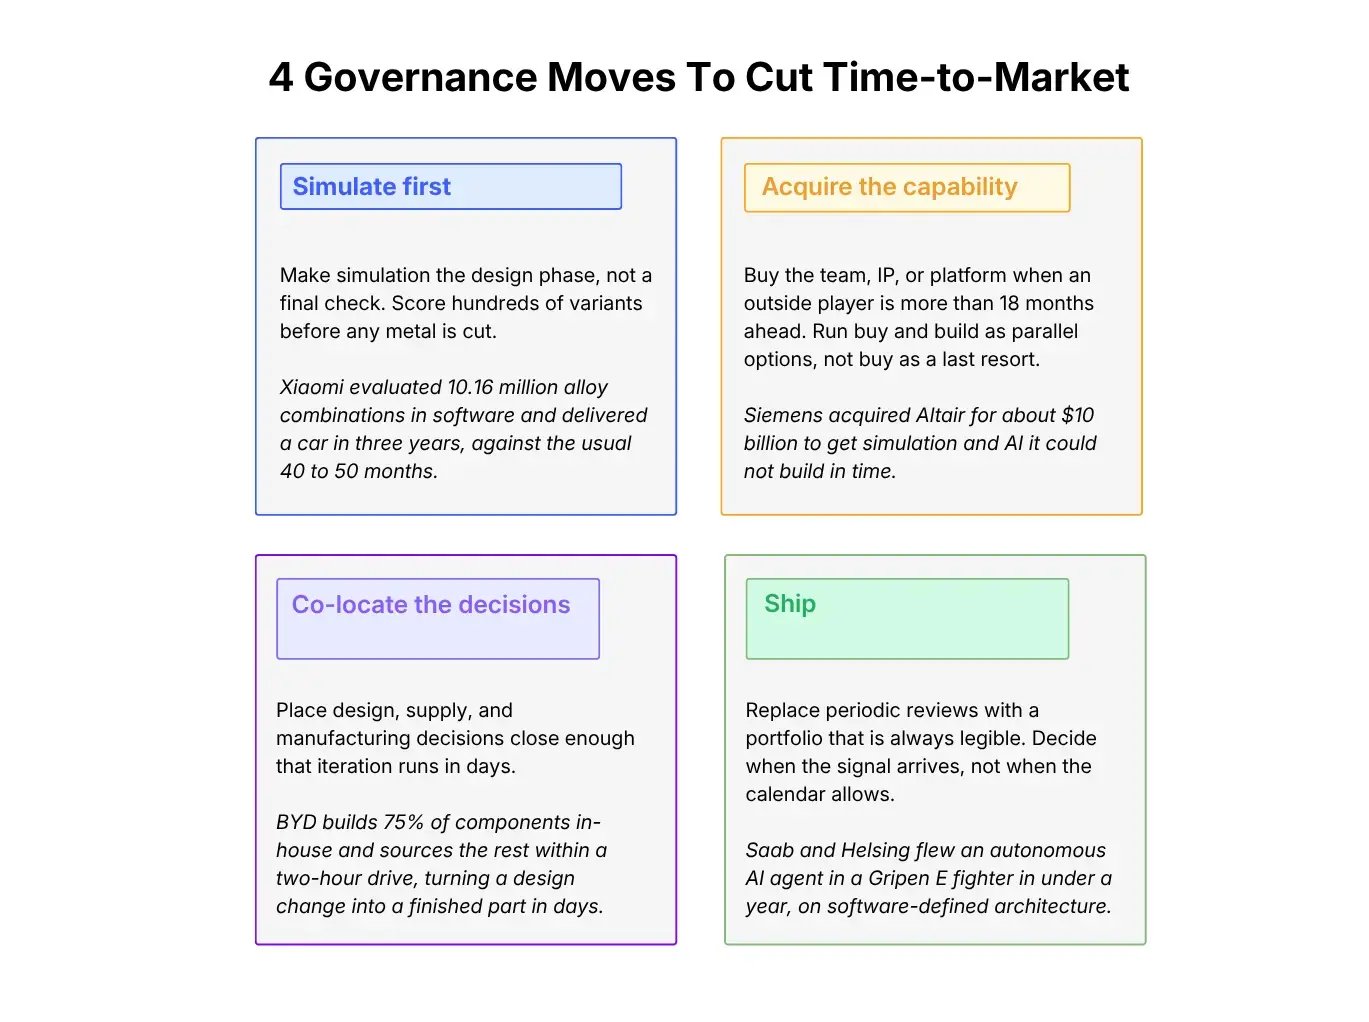
Exhibit: 4 governance moves to cut time-to-market
1. Simulate first to validate customer needs, prototype rarely
The old default makes the physical prototype the milestone. Progress is measured in prototypes built and iterated. The new default makes simulation the design phase. The sixty or five hundred variants that used to live in an engineer’s head now exist as scored candidates, compared and eliminated before any metal is cut.
Xiaomi went from announcing a car to customer delivery in three years, against the 40 to 50 months established automakers typically need. It built a simulation system that evaluated 10.16 million alloy combinations to select the body formula. The rear underbody alone gained a 17 percent weight reduction and 45 percent fewer production hours. The simulation phase cut years off the product development cycle, and with it the time to market.
Bühler, the Swiss machinery maker, compresses early-stage exploration to 60 variants in two weeks. CATL generates full virtual battery cell designs in minutes against weeks for manual approaches, on a platform trained on more than 100,000 design cases.
Simulation also lets teams test variants against customer needs, market research, and the core features the target audience actually values, turning early feedback into design choices rather than late rework.
The market measures that matter are decided before any metal is cut, which is how successful products reach the market quickly. PwC’s industry benchmarks show the pattern at the portfolio level: its Digital Champions achieve better outcomes while spending under 4 percent of revenue on R&D.
2. Acquire the software development capability that you cannot build in time
The old default is to build what you need. Hire a development team, set up the lab, and run the five-year programme. That was the logic behind most industrial IoT platform efforts from 2014 to 2020, and most of them missed the time to market that mattered.
The new default is to buy the capability that already exists, integrate it, and move on. Siemens acquired Altair for around 10 billion dollars, announced October 2024 and closed March 2025, the largest industrial software deal of the decade.
Siemens already had simulation capability and thousands of engineers. What it lacked was Altair’s specific combination of simulation, high-performance computing, and data science, and building the equivalent internally would have taken longer than the market would wait.
The unit of acquisition is whatever closes the gap fastest. Schneider Electric took Aveva fully private in 2023 to speed integration. In July 2025, Siemens hired a former Amazon Web Services Vice President of Generative AI as an executive leader. A company, a product line, or a single senior leader.
The deal logic and the hire logic are the same play. For software, simulation, and AI, the gap between leading technology companies and what a hardware firm can build alone is wider than a determined internal programme can close in time to market terms.
3. Co-locate supply chains around the decisions that drive iteration
The old default optimises global supply chains for unit cost. Design in one country, prototype in another, tool in a third. The new default co-locates the decisions that define iteration speed and time to market, even at a higher cost on specific components.
BYD builds 75 percent of its components in-house, against 46 percent for the Tesla Model 3 built in China. The remaining quarter comes from suppliers within a two-hour drive who turn a design change into a physical part in days.
Around TSMC, more than 500 semiconductor firms operate inside a single 1,400-hectare park, where interactions that take days elsewhere finish in hours. Firms inside the park generate about 50 percent value-add against 30 percent for those outside it. Co-located supply chains turn a design change into a tested part in days.
Toyota shows the same principle in an incumbent. Its most critical suppliers, including Denso, sit within a 20-kilometre radius of its headquarters in Aichi Prefecture. A design change needing cross-functional input gets resolved in a same-day meeting rather than a multi-week cycle across time zones.
A Western OEM cannot copy Shenzhen, and it does not need to. Supply chains optimised for unit cost can be re-pointed so that iteration distance, not postcode, sets the cycle time. The cost line rises. The schedule line drops.
/Still%20images/Kanban%20Board%20Mockups%202025/capabilities-views-kpi-aggregation.webp?width=2160&height=1350&name=capabilities-views-kpi-aggregation.webp)
Exhibit 5: A project portfolio board with KPI aggregation
4. Ship through continuous improvement by making the portfolio legible
The old default treats portfolio governance as a periodic event. Between reviews, the state of the portfolio is assembled from status reports into whatever format leadership prefers. The new default makes governance continuous because the portfolio is always legible. When a signal arrives, the decision happens then, not at the next scheduled review.
Saab and Helsing went from defining an operational scenario to flying an autonomous AI agent in a Gripen E fighter in less than a year, enabled by a software-defined architecture that separates hardware from software. Saab’s framing: in software, there are no generations, only speed.
Unitree ships new features to existing products on a software release cadence across a shared stack, so engineering improvements propagate across the range automatically.
Palantir’s Apollo pushes tens of thousands of software releases per week into regulated, air-gapped environments, with validated updates reaching field teams within 90 minutes. This is software development discipline applied to hardware, and it is what a faster TTM looks like in practice.
The lesson for industrial product development is blunt. The technical barrier to continuous portfolio governance is no longer the tooling.
Continuous improvement, short cycle time, and continuous feedback loops are available to any team willing to make the portfolio legible. Legible portfolios accelerate TTM and let firms ship innovative products from concept to finished product without sacrificing product quality, and without the quarterly wait.
What remains is the decision to stop treating governance as a report on the past and start treating it as a live view of the present, where a shorter time to market is the result.
Real-world examples: three industrial companies that removed coordination overhead
The cases below are real-world examples of industrial firms with genuine portfolio complexity that removed coordination overhead and measured the result.
Each faced the same structural problem: signals existed in the organisation that were not reaching the decisions that needed them. Each shortened its time to market by aligning product strategy with a legible portfolio.
Bosch: a structured external pipeline replaces ad-hoc scouting
Bosch had no systematic way to track the external innovation landscape. Relevant capabilities were found through personal networks or missed entirely. By the time a partner surfaced to leadership, the window had often closed.
Bosch built a structured external intake mechanism, its Open Innovation Partnerships platform, giving startups, universities, and experts a defined channel to submit solutions against active search fields.
Submissions run through a phase gate process from idea to evaluation to implementation, continuously rather than as a periodic sourcing exercise. The distance between an existing external solution and Bosch acting on it collapsed from months to weeks. This is the Acquire principle as organisational infrastructure.
Toyota Motor Europe: 40 tools collapsed into one
Toyota Motor Europe’s production engineering teams worked across multiple European centres with no shared view of what was being built or proposed. Information sat across roughly 40 different tools. Teams could not see what counterparts at other sites were working on, and cross-site collaboration required manual consolidation.
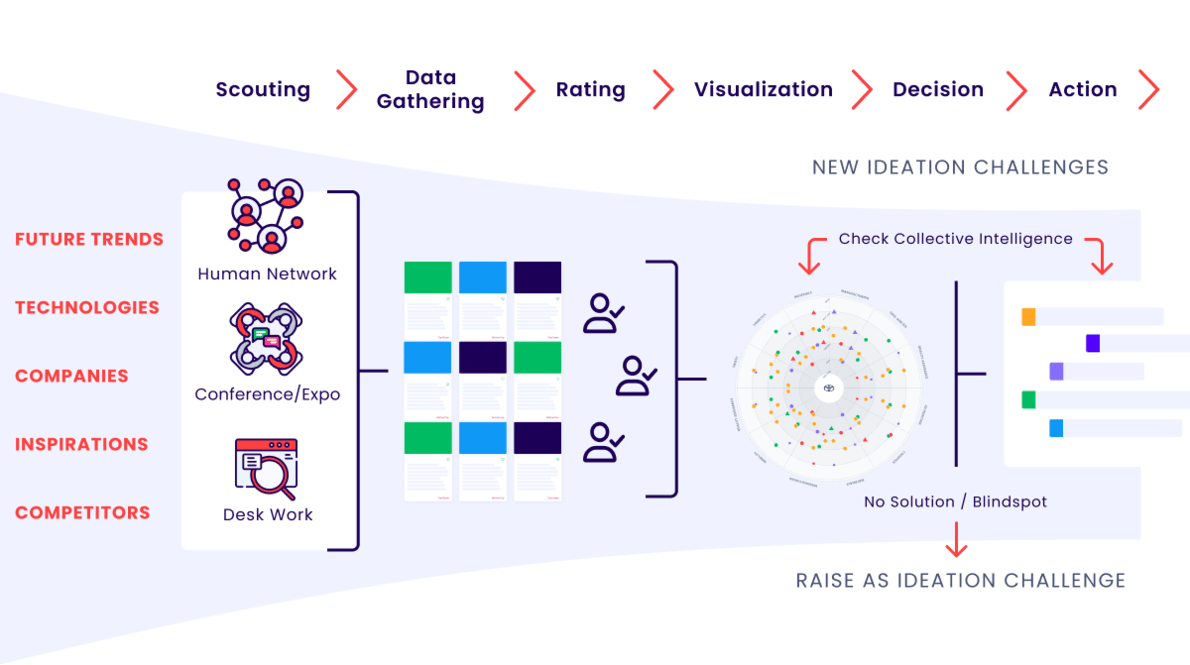
Exhibit: Innovation process at Toyota
Toyota collapsed the 40 tools into a single operating environment, bringing more than 500 members onto one shared system, which cut the time to market on shared programmes. Proposals are submitted digitally, evaluated by domain experts, and tracked through a clear pipeline.
The platform now holds 200+ projects worth over 20 million euros in a single view, with 500 external partners registered. As Andrew Willett, Senior Expert at Toyota Motor Europe, put it, targeted innovation requires a single source of information so people can find what is going on across the organisation.
Würth Group: three companies, one operating picture
Three of Würth’s core companies each ran their own foresight and ideation processes. Teams were unaware of parallel projects next door. The Group’s scale, which should have compounded intelligence, produced fragmented output instead.
Würth consolidated foresight, idea management, and strategy validation onto a single shared platform across all three companies. Shared trend radars now expose market trends and shifting market demands across entity boundaries, surfacing business opportunities that siloed product teams missed.
More than 2,000 users now collaborate on one operating picture, with duplicate efforts eliminated and faster, evidence-based decisions replacing siloed work.
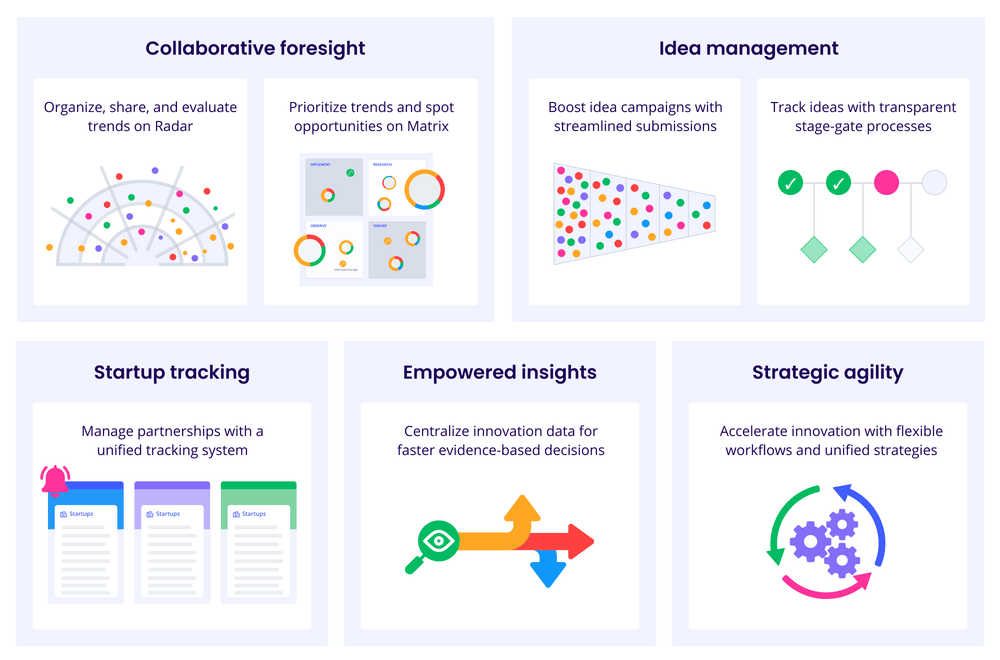
Exhibit: Würth innovation dimensions
Where to start fixing industrial product development
Start with your most expensive friction. Score where your product development process loses the most time, and treat the highest score as your primary constraint. The first moves cost little and reveal whether the drag is structural.
Map your approval layers
List every layer between an engineer identifying a needed change and that change reaching production. For each one, ask whether it adds value or whether nobody ever removed it. This takes two to three weeks of project management office time plus interviews with a handful of engineers and approvers.
A first pass typically removes 30 to 50 percent of approval steps. Decision latency on the affected paths drops from weeks to days, cutting the time to market on routine changes. Set a continuous-decision default afterward, and force the exceptions to justify themselves.
Re-cost simulation against prototypes
Price your simulation tooling against what it replaces. Tooling runs 50,000 to 500,000 dollars. Each prototype cycle costs 200,000 to 2 million. Most teams under-invest in simulation by an order of magnitude.
This reframes simulation as cost avoidance rather than new spending. The budget approval that was stuck for years tends to clear once the comparison is on one page. Run one live design question through both paths to calibrate accuracy on your own products.
Apply the daily walk test
If solving a recurring supplier or cross-team problem needs a scheduled weekly call, the loop is too long. Aim for problems that can be resolved face-to-face the same day. The test is a hiring and location filter for new programmes, not a project.
Then, continually assess which internal capability programmes have run past 24 months without closing the gap on the external leader. If the gap has not closed in two years, it is unlikely to close in the next two. That is your buy-versus-build shortlist.
Where ITONICS fits the new playbook
Three of the four moves depend on one capability: making the portfolio and strategic planning legible so decisions happen when the signal arrives. That is the structural problem ITONICS addresses.
/Still%20images/Roadmap%20Mockups%202025/portfolio-visualize-critical-paths-2025.webp?width=2160&height=1350&name=portfolio-visualize-critical-paths-2025.webp)
Exhibit: Roadmap with projects and milestones showing schedule conflicts | ITONICS
ITONICS is the operating system for R&D, product, and innovation teams. It connects market and new technology intelligence, strategic priorities, and the project portfolio in one system, across four stages from market intelligence to execution health.
Technology and competitor radars surface market trends, shifting regulatory requirements, and customer feedback, and customer needs that signal where a product strategy must move.
Structured idea pipelines move a product concept and a raw product idea from intake to launching products.
Dynamic roadmaps and portfolio views give any decision-maker a real-time picture of what is being built, at what cost, and how it connects to everything else, so product teams steer toward a faster TTM.
You have the blueprint. The four moves reduce time to market by removing governance friction, not by adding budget. A legible portfolio lets teams accelerate TTM, hit the market faster, and build a durable competitive advantage on customer feedback and customer satisfaction rather than guesswork.
The system that makes the portfolio legible is what turns the blueprint into a faster development process and a measurable edge in time to market.
